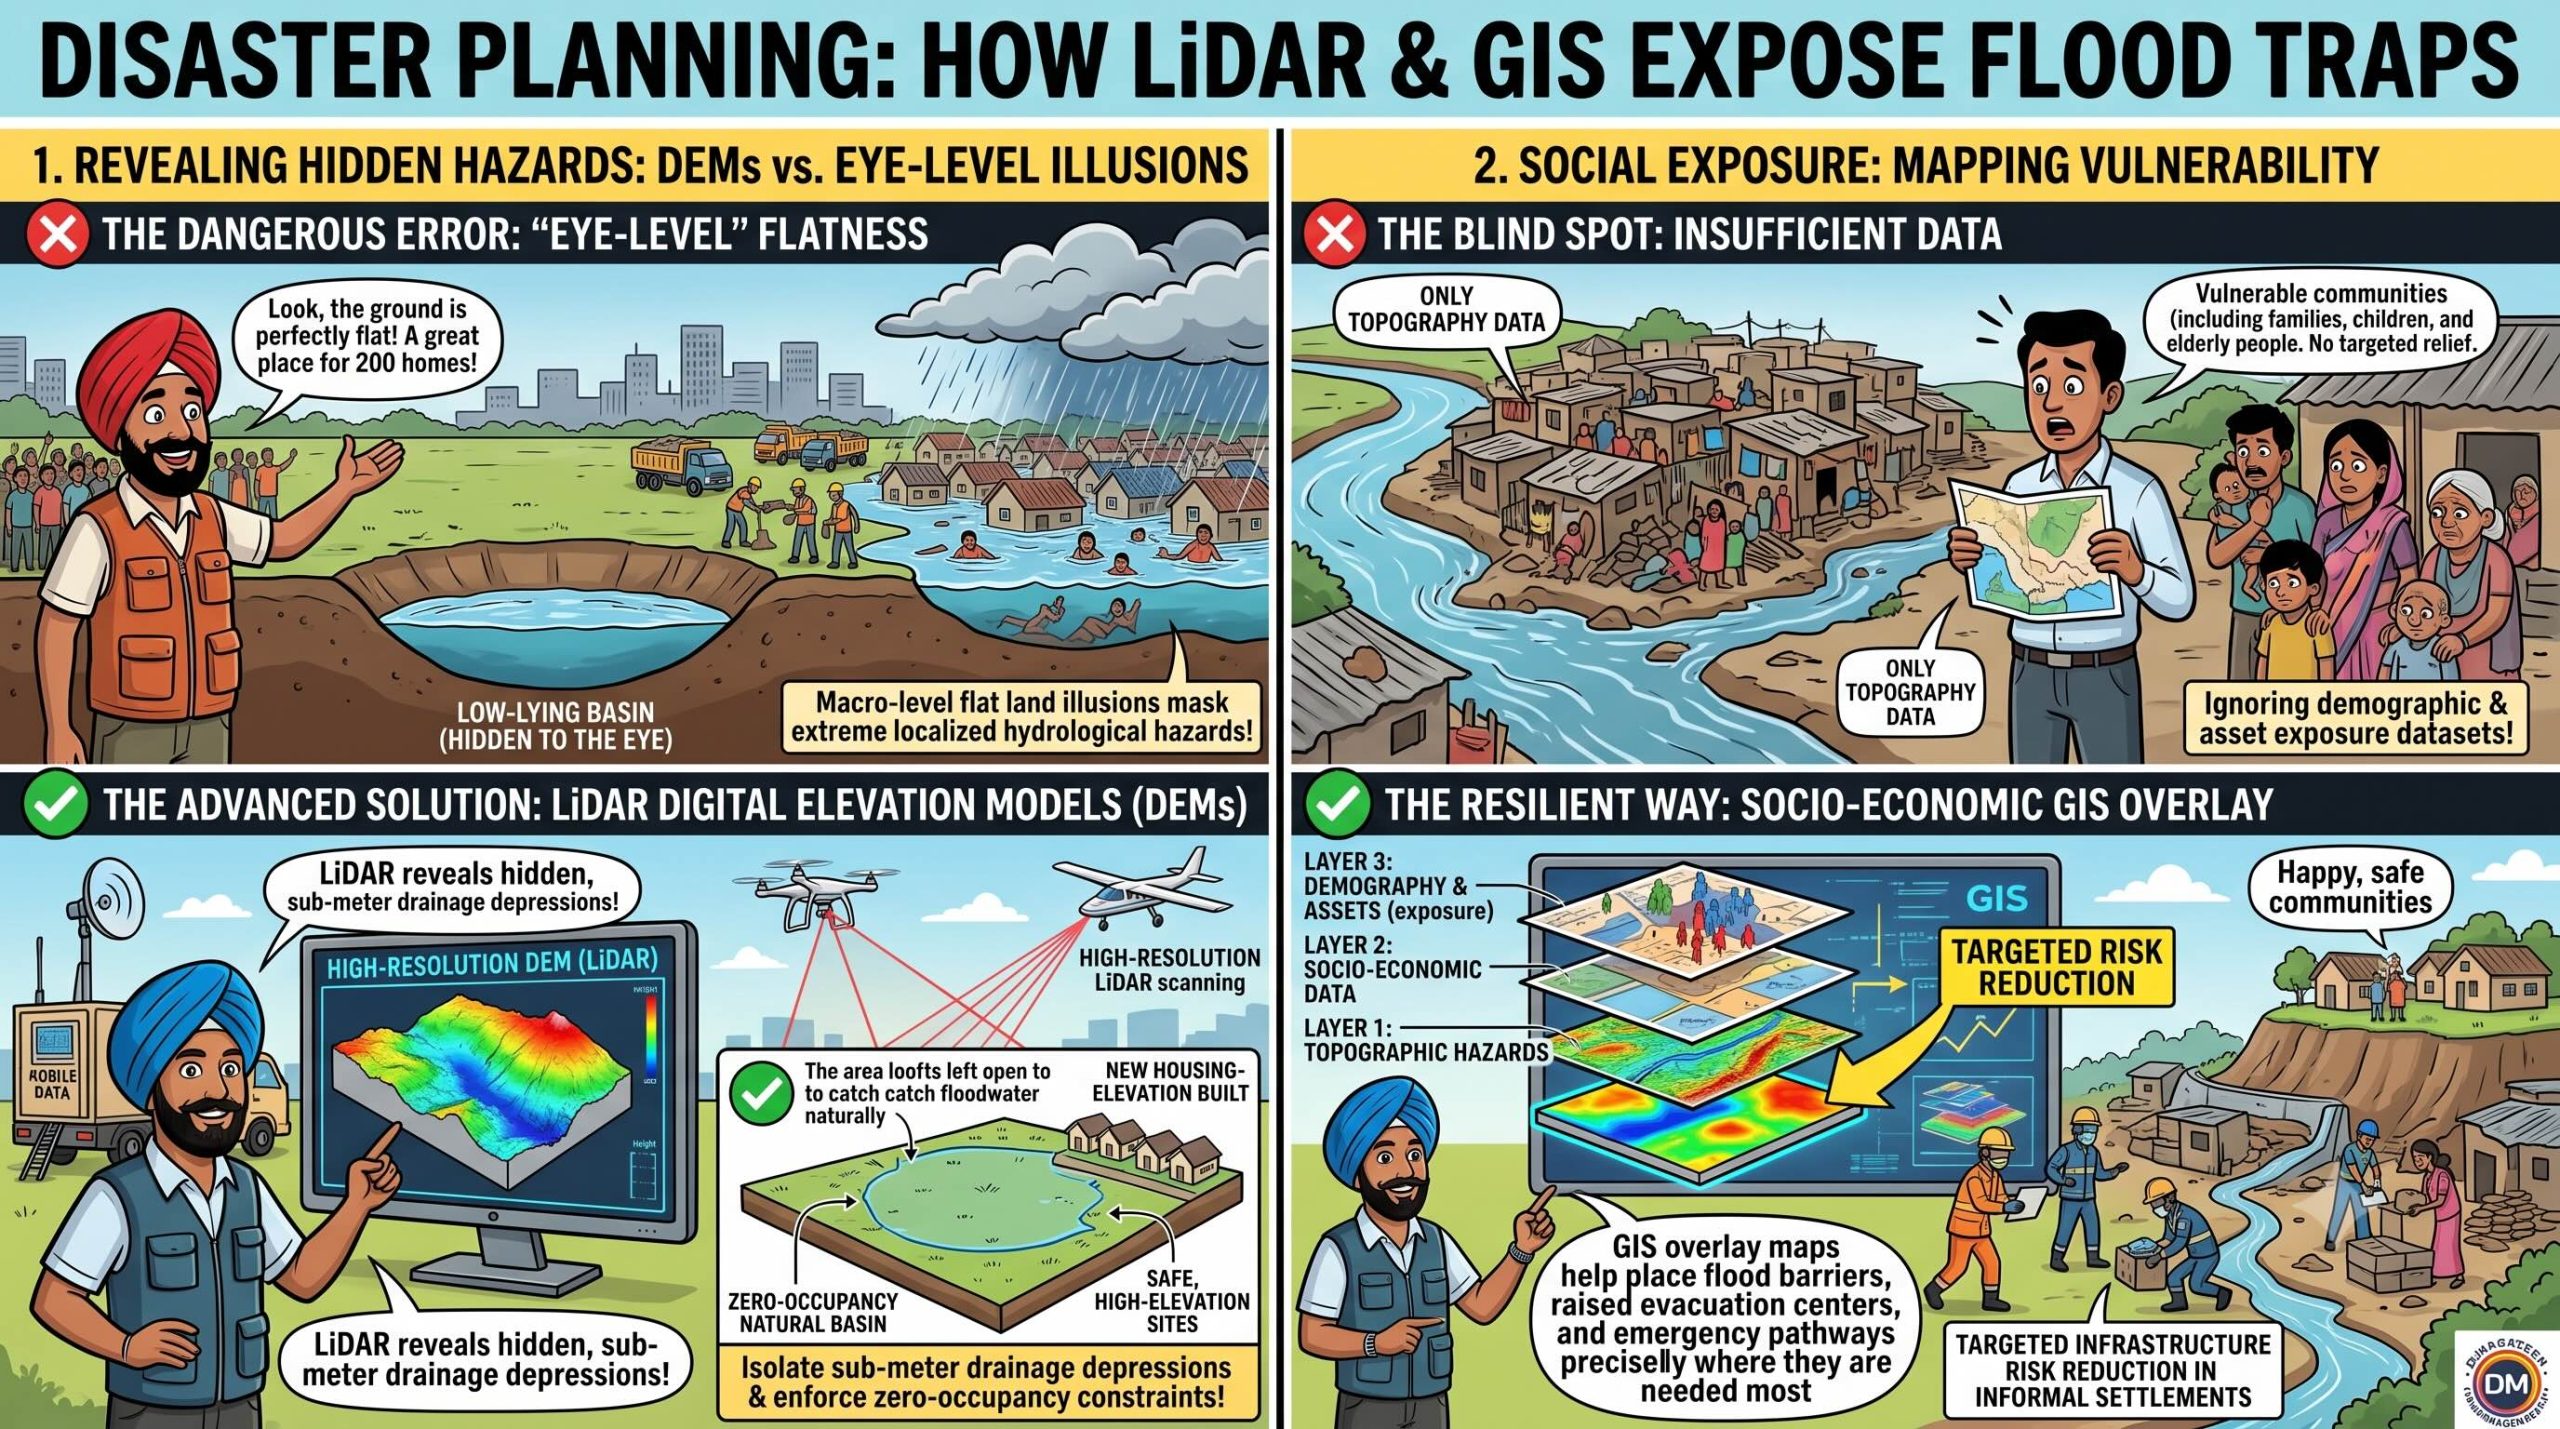
 Santa was working as a high-density urban housing contractor, standing inside a low-lying, swampy informal settlement basin on the outskirts of a booming megacity.
He was selling micro-plots for a new residential development scheme, sketching lines on a plain sheet of cardboard.
“Oye Banta, look at this economic housing masterstroke!” Santa laughed, pockets overflowing with token advance cash.
“The land is completely flat, the city population is exploding, and I am packing two hundred family quarters into this single block!”
“Why look at boring regional zoning files when the layout looks perfectly clear and level on the ground?”
Banta walked onto the construction site, carrying a laptop displaying a high-resolution Digital Elevation Model (DEM) derived from airborne LiDAR telemetry, integrated with a socio-economic population exposure layer.
“Santa-ji, you think your layout is level, but your cardboard sketch is a layout for a deep-water cage!” Banta said, turning the laptop screen toward Santa.
“You are completely blind to the volumetric topography of this basin!”
Santa shrugged, tapping his leather boots on the mud.
“Oye Banta!”
“The ground feels solid and flat under my feet!”
“Why look at a computer graphic when the terrain is clearly horizontal?”
“Because your feet cannot measure a sub-meter elevation depression, Santa!” Banta shouted, pointing to a dark purple contour sink on the digital elevation model.
“This high-resolution DEM shows that this entire informal block sits squarely inside an absolute hydrological sink that is five meters below the adjacent river embankment!”
“Globally, the UNDRR reports that climate disasters between 2000 and 2019 affected 4.2 billion people and caused nearly $3 trillion in economic losses, with data-scarce megacities and informal settlements bearing the absolute brunt of the impact.”
“When you overlay this topography with our GIS demographic data—including population density, child exposure metrics, and low-income socio-economic layers—the system flags this site as a catastrophic hazard trap!”
“If a localized cloudburst hits, this entire settlement will turn into an absolute swimming pool within ten minutes, with zero natural drainage escape routes!”
“Real risk assessment means using geospatial engineering to block development in these vulnerable basins before you mix a single batch of concrete!”
Santa watched the GIS simulation fill his exact construction grid with a deep blue flood marker on the screen, the data-driven precision shattering his profit margin logic.
He slowly handed back the cash to his buyers.
“Oye… so the computer map knows the depth of the water before the river even arrives?”
“Yes, Santa-ji,” Banta said seriously.
“A smart developer uses the digital elevation mirror to build above the hazard line, not inside the drain.”
संता – बंता की इस जुगलबन्दी से आज हमने क्या सीखा:-
- डिजिटल एलिवेशन मॉडल (DEM) की सटीकता / The Precision of Digital Elevation Modelling:
- मैदानी इलाकों का समतल दिखना अक्सर गंभीर जल-वैज्ञानिक खतरों को छिपा देता है। शहरी विकास के लिये हाई-रिज़ॉल्यूशन लिडार (LiDAR) और ‘डिजिटल एलिवेशन मॉडल‘ (DEM) का उपयोग किया जाना चाहिये, ताकि जलभराव वाले निचले क्षेत्रों की पहचान कर वहां बहुमंजिला निर्माणों को रोका जा सके / Macro-level flat land illusions mask extreme localized hydrological hazards. Urban planning must utilize high-resolution LiDAR-derived Digital Elevation Models (DEMs) to isolate sub-meter drainage depressions and enforce zero-occupancy constraints on flood-prone basins.
- सामाजिक–आर्थिक जीआईएस (GIS) डेटा का एकीकरण / Socio-Economic GIS Exposure Overlay:
- केवल भौगोलिक मानचित्रण (mapping) काफी नहीं है; इसके साथ स्थानीय जनसंख्या घनत्व, आर्थिक स्थिति और बुनियादी ढांचे के डेटा को भौगोलिक सूचना प्रणाली (GIS) पर एक साथ रखकर संवेदनशील अनौपचारिक बस्तियों (informal settlements) के लिये विशेष सुरक्षा योजनाएं बनाई जानी चाहिये / Vulnerability mapping requires combining topographic layers with dense demographic, asset exposure, and socio-economic datasets to execute targeted infrastructure risk reduction inside informal settlements.
संता – बंता की यह जुगलबन्दी आपको कैसी लगी, कृपया हमें जरुर बताये
व
इस जुगलबन्दी को बेहतर बनाने के लिये अपने सुझाव अवश्य दें।
हमें हमेशा की तरह आपके सुझावों, प्रतिक्रियाओं व कटाक्षो का बेसब्री से इंतजार रहता हैं औरसच मानिये इसी के आधार पर हम अपने आप में, अपनी सोच व रचनात्मकता में सुधार करने कोप्रेरित होते हैं।
सो अच्छा – बुरा जैसा आपको महसूस हुवा हो, कमेंट जरुर करते रहें।
#DigitalElevationModels #LiDARData #VulnerabilityMapping #UrbanRiskZoning#InformalSettlements #SantaBantaStories
Leave a Reply